tstat2: 1-Sample t-Test Statistic (Single-Choice)
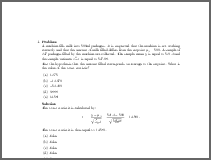
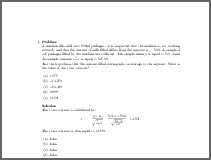
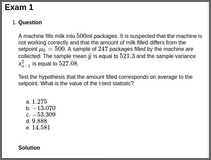
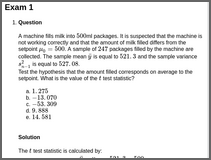
tstat2A machine fills milk into \(500\)ml packages. It is suspected that the machine is not working correctly and that the amount of milk filled differs from the setpoint \(\mu_0 = 500\). A sample of \(247\) packages filled by the machine are collected. The sample mean \(\bar{y}\) is equal to \(521.3\) and the sample variance \(s^2_{n-1}\) is equal to \(527.08\).
Test the hypothesis that the amount filled corresponds on average to the setpoint. What is the value of the t-test statistic?
The t-test statistic is calculated by: \[ \begin{aligned} t & = & \frac{\bar y - \mu_0}{\sqrt{\frac{s^2_{n-1}}{n}}} = \frac{521.3 - 500}{\sqrt{\frac{527.08}{247}}} = 14.581. \end{aligned} \] The t-test statistic is thus equal to \(14.581\).
- False
- False
- False
- False
- True
A machine fills milk into \(250\)ml packages. It is suspected that the machine is not working correctly and that the amount of milk filled differs from the setpoint \(\mu_0 = 250\). A sample of \(248\) packages filled by the machine are collected. The sample mean \(\bar{y}\) is equal to \(231.1\) and the sample variance \(s^2_{n-1}\) is equal to \(53.84\).
Test the hypothesis that the amount filled corresponds on average to the setpoint. What is the value of the t-test statistic?
The t-test statistic is calculated by: \[ \begin{aligned} t & = & \frac{\bar y - \mu_0}{\sqrt{\frac{s^2_{n-1}}{n}}} = \frac{231.1 - 250}{\sqrt{\frac{53.84}{248}}} = -40.563. \end{aligned} \] The t-test statistic is thus equal to \(-40.563\).
- False
- False
- True
- False
- False
A machine fills milk into \(200\)ml packages. It is suspected that the machine is not working correctly and that the amount of milk filled differs from the setpoint \(\mu_0 = 200\). A sample of \(122\) packages filled by the machine are collected. The sample mean \(\bar{y}\) is equal to \(202.2\) and the sample variance \(s^2_{n-1}\) is equal to \(52.67\).
Test the hypothesis that the amount filled corresponds on average to the setpoint. What is the value of the t-test statistic?
The t-test statistic is calculated by: \[ \begin{aligned} t & = & \frac{\bar y - \mu_0}{\sqrt{\frac{s^2_{n-1}}{n}}} = \frac{202.2 - 200}{\sqrt{\frac{52.67}{122}}} = 3.348. \end{aligned} \] The t-test statistic is thus equal to \(3.348\).
- False
- False
- False
- False
- True
(Note that the HTML output contains mathematical equations in MathML, rendered by MathJax using ‘mathjax = TRUE’. Instead it is also possible to use ‘converter = “pandoc-mathjax”’ so that LaTeX equations are rendered by MathJax directly.)
Demo code:
library("exams")

set.seed(403)
exams2html("tstat2.Rmd", mathjax = TRUE)
set.seed(403)
exams2pdf("tstat2.Rmd")

set.seed(403)
exams2html("tstat2.Rnw", mathjax = TRUE)
set.seed(403)
exams2pdf("tstat2.Rnw")


