essayreg: Linear Regression (Essay Question)
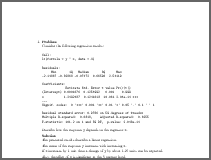
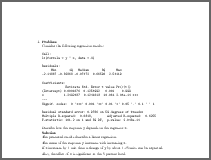
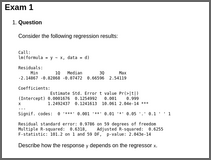
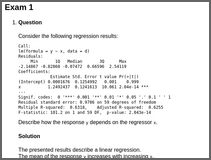
essayregConsider the following regression results:
Call:
lm(formula = y ~ x, data = d)

Residuals:
     Min       1Q   Median       3Q      Max
-2.14867 -0.82868 -0.07472  0.66596  2.54119

Coefficients:
             Estimate Std. Error t value Pr(>|t|)
(Intercept) 0.0001676  0.1254992   0.001    0.999
x           1.2492437  0.1241613  10.061 2.04e-14

Residual standard error: 0.9786 on 59 degrees of freedom
Multiple R-squared:  0.6318,    Adjusted R-squared:  0.6255
F-statistic: 101.2 on 1 and 59 DF,  p-value: 2.043e-14
Describe how the response y depends on the regressor x.
The presented results describe a linear regression.
The mean of the response y increases with increasing x.
If x increases by 1 unit then a change of y by about 1.25 units can be expected.
Also, the effect of x is significant at the 5 percent level.
Consider the following regression results:
Call:
lm(formula = y ~ x, data = d)

Residuals:
     Min       1Q   Median       3Q      Max
-1.02232 -0.27147 -0.00678  0.25588  1.02013

Coefficients:
            Estimate Std. Error t value Pr(>|t|)
(Intercept)  0.05704    0.06948   0.821    0.415
x            0.52884    0.06511   8.122 8.17e-11

Residual standard error: 0.5106 on 52 degrees of freedom
Multiple R-squared:  0.5592,    Adjusted R-squared:  0.5507
F-statistic: 65.96 on 1 and 52 DF,  p-value: 8.175e-11
Describe how the response y depends on the regressor x.
The presented results describe a linear regression.
The mean of the response y increases with increasing x.
If x increases by 1 unit then a change of y by about 0.53 units can be expected.
Also, the effect of x is significant at the 5 percent level.
Consider the following regression results:
Call:
lm(formula = y ~ x, data = d)

Residuals:
    Min      1Q  Median      3Q     Max
-3.3262 -1.0275 -0.0741  1.2578  4.4282

Coefficients:
            Estimate Std. Error t value Pr(>|t|)
(Intercept)  0.05518    0.25280   0.218   0.8282
x           -0.42237    0.23631  -1.787   0.0806

Residual standard error: 1.713 on 45 degrees of freedom
Multiple R-squared:  0.06629,   Adjusted R-squared:  0.04554
F-statistic: 3.195 on 1 and 45 DF,  p-value: 0.08062
Describe how the response y depends on the regressor x.
The presented results describe a linear regression.
The mean of the response y decreases with increasing x.
If x increases by 1 unit then a change of y by about -0.42 units can be expected.
However, the effect of x is not significant at the 5 percent level.
(Note that the HTML output contains mathematical equations in MathML, rendered by MathJax using ‘mathjax = TRUE’. Instead it is also possible to use ‘converter = “pandoc-mathjax”’ so that LaTeX equations are rendered by MathJax directly.)
Demo code:
library("exams")

set.seed(403)
exams2html("essayreg.Rmd", mathjax = TRUE)
set.seed(403)
exams2pdf("essayreg.Rmd")

set.seed(403)
exams2html("essayreg.Rnw", mathjax = TRUE)
set.seed(403)
exams2pdf("essayreg.Rnw")


