boxhist2: Univariate Exploration of a CSV File (Flexible Formatting)
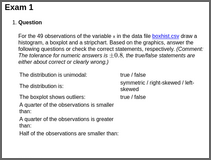
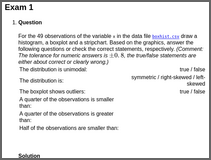
boxhist2For the 49 observations of the variable x in the data file boxhist.csv draw a histogram, a boxplot and a stripchart. Based on the graphics, answer the following questions or check the correct statements, respectively. (Comment: The tolerance for numeric answers is \(\pm0.8\), the true/false statements are either about correct or clearly wrong.)
| The distribution is unimodal: | |
| The distribution is: | |
| The boxplot shows outliers: | |
| A quarter of the observations is smaller than: | |
| A quarter of the observations is greater than: | |
| Half of the observations are smaller than: |
- False / True
- True / False / False
- False / True
- 2.55
- 13.1
- 10.4
For the 34 observations of the variable x in the data file boxhist.csv draw a histogram, a boxplot and a stripchart. Based on the graphics, answer the following questions or check the correct statements, respectively. (Comment: The tolerance for numeric answers is \(\pm0.2\), the true/false statements are either about correct or clearly wrong.)
| The distribution is unimodal: | |
| The distribution is: | |
| The boxplot shows outliers: | |
| A quarter of the observations is smaller than: | |
| A quarter of the observations is greater than: | |
| Half of the observations are smaller than: |
- True / False
- False / True / False
- True / False
- 3.27
- 4.69
- 3.45
For the 49 observations of the variable x in the data file boxhist.csv draw a histogram, a boxplot and a stripchart. Based on the graphics, answer the following questions or check the correct statements, respectively. (Comment: The tolerance for numeric answers is \(\pm0.6\), the true/false statements are either about correct or clearly wrong.)
| The distribution is unimodal: | |
| The distribution is: | |
| The boxplot shows outliers: | |
| A quarter of the observations is smaller than: | |
| A quarter of the observations is greater than: | |
| Half of the observations are smaller than: |
- False / True
- True / False / False
- False / True
- 4
- 15
- 13.7
(Note that the HTML output contains mathematical equations in MathML, rendered by MathJax using ‘mathjax = TRUE’. Instead it is also possible to use ‘converter = “pandoc-mathjax”’ so that LaTeX equations are rendered by MathJax directly.)
Demo code:
library("exams")

set.seed(403)
exams2html("boxhist2.Rmd", mathjax = TRUE)
set.seed(403)
exams2pdf("boxhist2.Rmd")

set.seed(403)
exams2html("boxhist2.Rnw", mathjax = TRUE)
set.seed(403)
exams2pdf("boxhist2.Rnw")


