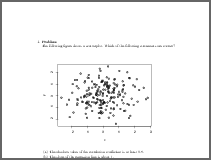
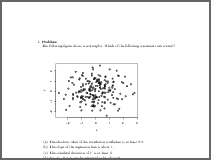
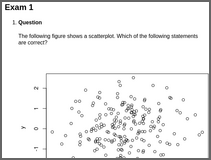
scatterplot: Interpretation of a Scatterplot
Name:
scatterplotType:
Description:
Scatterplot in an (x, y) regression setup needs to be interpreted regarding location/spread of the marginal distributions, the correlation in the joint distribution, and the corresponding regression slope. Data are drawn randomly from a suitable data-generating process so that each multiple-choice item is either about correct or clearly wrong.
Solution feedback:
Yes
Randomization:
Random numbers, text blocks, and graphics
Mathematical notation:
No
Verbatim R input/output:
No
Images:
Yes
Other supplements:
No
PDF:
HTML:

Demo code:
library("exams")

set.seed(403)
exams2html("scatterplot.Rmd")
set.seed(403)
exams2pdf("scatterplot.Rmd")

set.seed(403)
exams2html("scatterplot.Rnw")
set.seed(403)
exams2pdf("scatterplot.Rnw")